“HelloWorld The Hard Way cont. Part 2”
Written on November 14th, 2019 by |3ASS3XE
Stepping Through HelloWorld the Hard Way
“If you know the enemy and know yourself, you need not fear the result of a hundred battles.”-Sun Tzu, The Art of War.
So we’ve just created our first Hello World program in NASM Assembly Programming Language; congrats. Now we will step back through our program using GDB to have for 360 analysis of our creation. GDB is a GNU command line debugger native to the UNIX operating system and is an effective tool in program analysis.
gdb -q HELLOWORLD
To find our first entry point in our HELLOWORLD program we can read the header files to obtain the Entry Point Address; the location of the first executed instruction.
(gdb) shell readelf -h HELLOWORLD (Executes a shell and uses readelf with -h parameter to read the Header files)
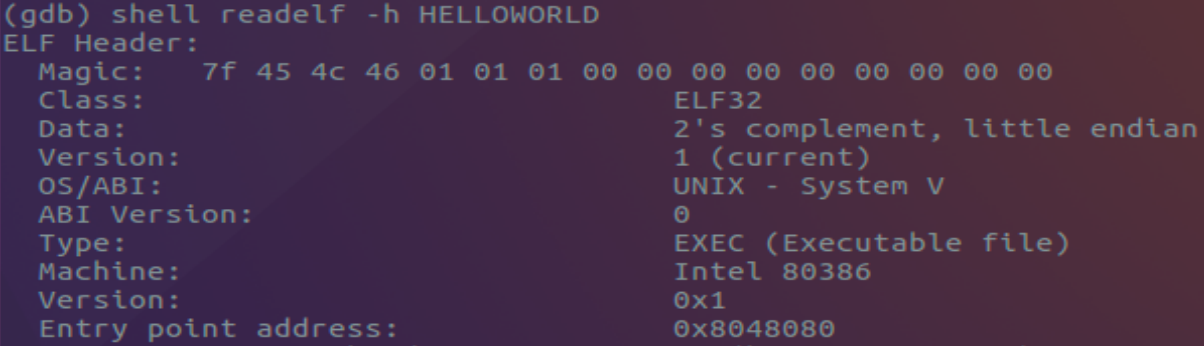
Our program’s entry point for our program is 0x8048080 and will be the location for our first breakpoint. Setting a breakpoint within GDB is done with the either of the following
(gdb)break *0x8048080 OR (gdb)b *0x8048080
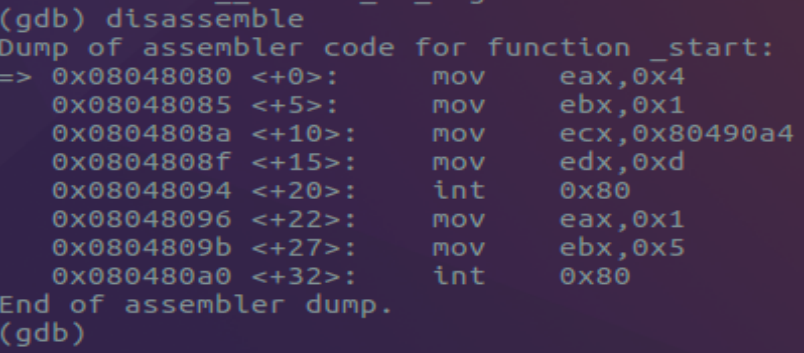
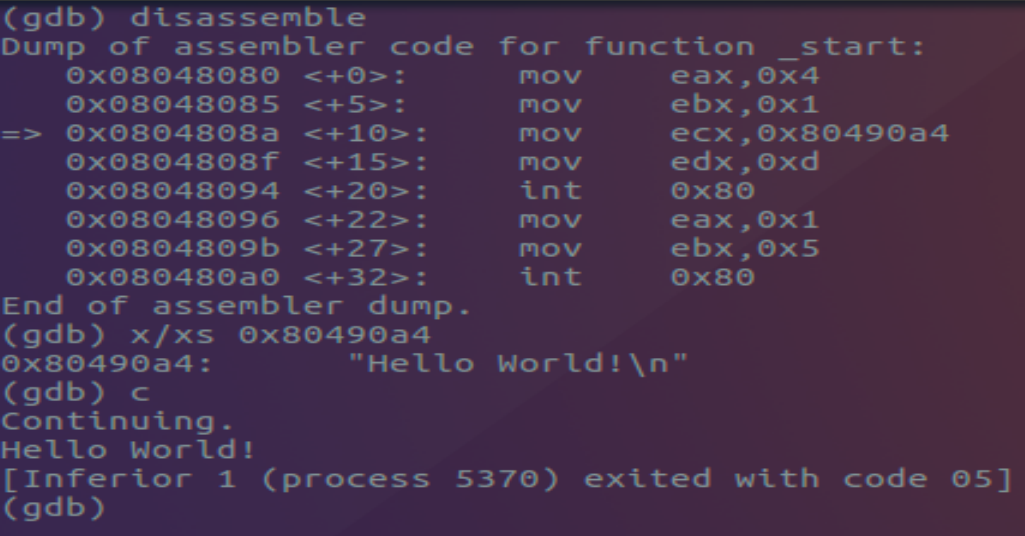
Using the run command executes our program where it halts at the pre-established breakpoint. From here using the disassemble command prints to screen the assembly code executed within HELLOWORLD.

On the left most column we have the memory address associated with the instructions to be executed to the right. The arrow signifies the register EIP which points to the next instruction to be executed. Using the following info registers command prints a listing of registers with current values stored within them.
(gdb)info registers OR (gdb) i r
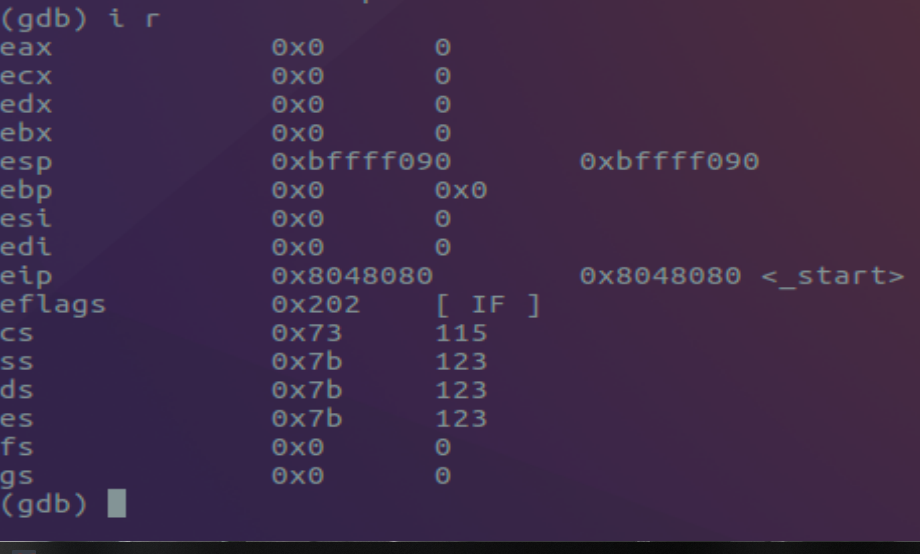
Within this context we can also see that the register EIP is pointing to the memory address 0x8048080 / _start(Our designated label for entry)
As we step through our program using step i and using the same analysis process we see a play by play instance of code execution. While not groundbreaking, I find this aspect of programming exciting. There is a sense of accomplishment in not only creating something new and functional but having the ability to slow the process down to a crawl.
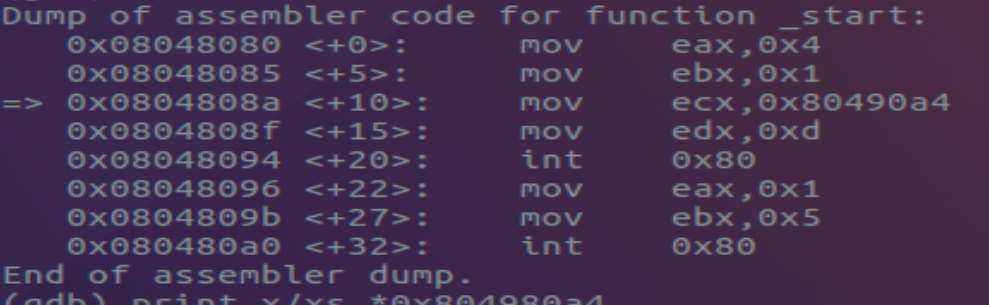
Eventually the register EIPpoints to the memory address 0x0804808a which references mov ecx, 0x80490a4
Examining the memory address located at 0x80490a4 reveals the obvious “Hello World!” with an end of line escape character trailing behind. Using the **continue ** command we allow the program to continue execution as designed; printing “Hello World!” to screen and properly exiting returning the value 5.
Being able to effectively use a debugging application like GDB or X64 is crucial in both the realm of Software Development and RE. The importance lies in being able to understand how programs, think and execute on a basic level. Within high-level programs there is a huge level of abstraction from the programmer’s logic and how the program executes logic. RE work in my opinion, is the bridge between those layers and creates transparency from intent to execution.